Applying Social Network Analysis in WASH in Uganda and Kenya


Welcome to the second installment of the Social Network Analysis (SNA) in WASH Blog Series from Sustainable WASH Systems (SWS) Learning Partnership. Social Network Analysis is a unique data visualization tool that can be harnessed by all development sectors, and is particularly useful to WASH.
This blog, Applying Social Network Analysis in WASH in Uganda and Kenya, explores how SNA results improved SWS initiatives in these countries. The first entry, Learning About Social Network Analysis in WASH Programs, defines social network analysis and suggests when during the program cycle to implement this tool for best results. The third, Social Network Analysis: Your Questions Answered, addresses best practices for conducting an analysis and applying findings to WASH programs.
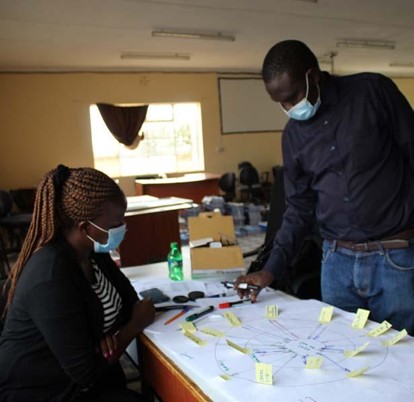
Photo above: Interview participant describing network interactions in Kitui County. Photo by Angeline Mulwa. 2020
As part of the USAID–funded Sustainable WASH Systems Learning Partnership (SWS), LINC, University of Oxford and Whave Solutions conducted baseline and endline Social Network Analyses (SNA). These analyses are providing partners in Kenya and Uganda with vital WASH network understanding to improve how they provide clean, safe water to rural areas in each country.
Network analyses yield quantified visual “maps” and metrics to identify how network actors collaborate, share information and coordinate. Importantly, SNA takes into account local actors and the complex contexts in which they exist to more effectively design, implement, monitor and evaluate locally-led initiatives.
SWS partners are training local WASH leaders in Kenya and Uganda to carry out SNAs — one of many systems-thinking tools SWS is learning about, applying, and amplifying in the WASH sector.
During a recent LINC–moderated panel discussion on the value of network analysis in WASH, LINC’s Rich Fromer talked with Cliff Nyaga from Oxford and Joel Mukanga from Whave about how their organizations are conducting SNA and applying their results to improve collaboration, knowledge sharing, and WASH systems at the local level.
In Kenya, Oxford is working closely with the Kitui County government, the Kitui WASH Forum (a local WASH network), and other stakeholders to enhance their coordination for more effective water service delivery at the county level. Nyaga says their SNA has made a profound impact on this shared end goal. Network analysis helped his team “understand who's in the network, stakeholder priorities, interaction levels, and their alignments and misalignments to ... essentially understand the impact and effectiveness of our work.”
Specifically, an endline SNA helped Kitui WASH stakeholders realize its network was broader and deeper than originally imagined.
“We actually found that the network is much bigger than we thought.” Rather than comprising 25 individuals and entities, all members from the Kitui WASH Forum, the endline analysis “identified up to 75 WASH actors in the network,” explains Nyaga.
He adds, “Most aren’t necessarily participating in the Kitui WASH forum, but provide important bridges to the forum and include NGO and government actors.
“This was a key insight because it allowed us to strengthen [bonds] and put in structures that reinforce the government’s role in the forum, which now includes members from the education and health sectors, and more NGOs.”
Whave delivers professional water pump maintenance to about 550 rural Ugandan communities. Mukanga says the SNA helped his team “to reorganize, plan, and evaluate successes.” He and his team used the in-depth analysis to understand the “different players’ ideas and skill levels, as well as relationship strengths and resource flows.” Mukanga adds it is useful to conduct these analyses periodically to understand how stakeholders and networks “change and shift over time depending on projects and goals.”
For example, information from a 2020 SNA alerted Whave that a once-central stakeholder was no longer serving Kamuli District because they shifted resources elsewhere. Importantly, the SNA helped Mukanga and his team get an up-to-date understanding of who their relevant and reliable working partners are.
“If we didn't have that analysis, we probably would keep them in our records, but without them adding value to our progress,” says Mukanga. He adds that the SNA also helped his team realize “there were also a few government staff members and civil servants who were central figures in 2018, but now aren’t.” This is the type of vital information that SNAs produce, enabling organizations to pivot and adapt to their evolving network connections.
In contrast to Fundifix, the SNA helped Whave learn who was, in fact, no longer within its network, enabling the organization to adjust operations accordingly.
While these are highlights of network analysis, SNAs can have drawbacks, including sometimes costly and time-consuming data collection and results that can be prone to bias. Additionally, SNA results that indicate collaborative networks might not necessarily mean that the main initiative is on track, so other monitoring methods still need to be used to evaluate overall project outcomes.
However, as Nyaga and Mukanga mention, SNAs can contribute rich, valuable, and practical information to WASH programs, helping teams make data-driven decisions to fortify WASH networks and, overall, create more strategic and comprehensive programs that enable sustained water and sanitation systems.
--------------
Erin Fiorini is a Communications Associate for Sustainable WASH Systems Learning Partnership (SWS).